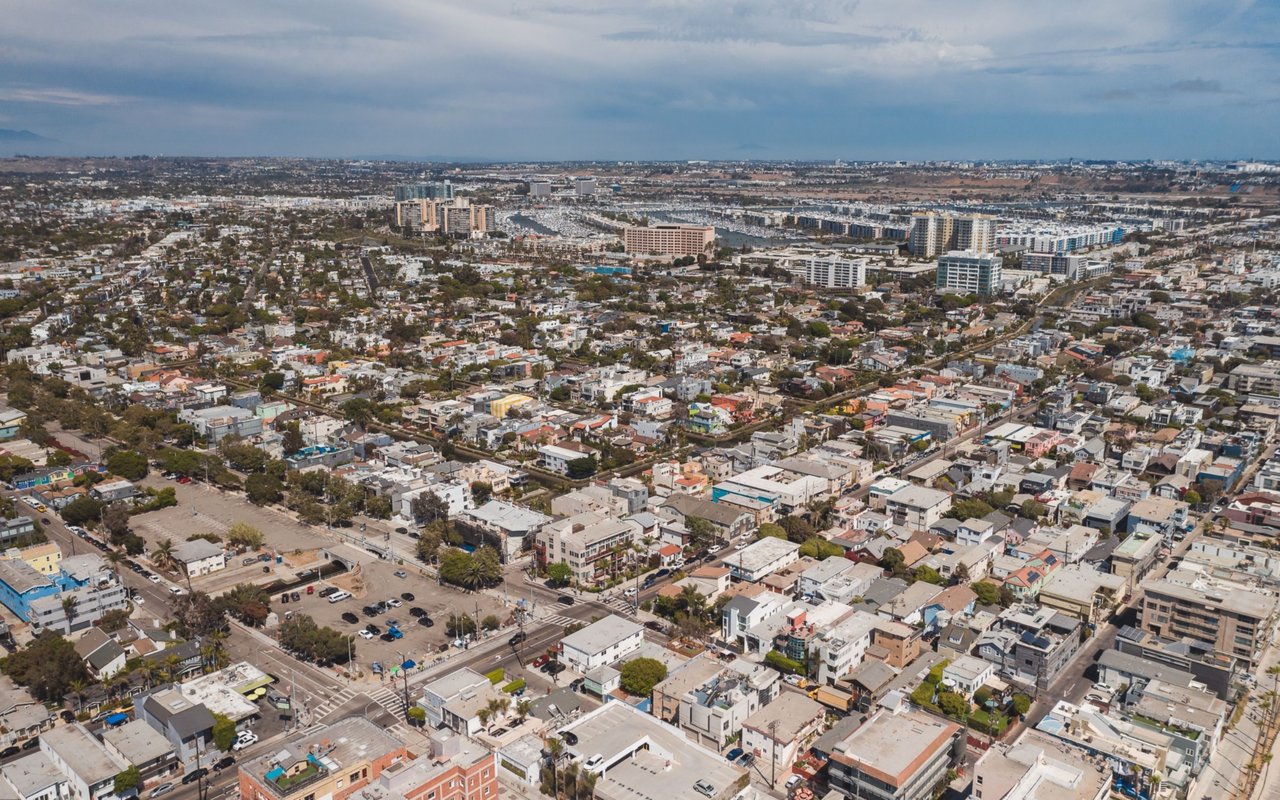
Is a highly sought-after, trendy area of Costa Mesa that has something for everyone. Eastside Costa Mesa is located adjacent to Newport Beach and shares many of the same award-winning schools. Because of this, the property values in Eastside Costa Mesa tend to be the highest of any other part of Costa Mesa.
Eastside Costa Mesa borders Newport Boulevard, 15th Street, Mesa Drive, and Irvine Boulevard on the east. There are condominiums, single-family homes, and multi-unit properties alike. One of the many draws to Eastside Costa Mesa is the Shopping and Dining on East 17th Street, which runs right down the middle of Eastside Costa Mesa and has become a premier shopping and dining district!
24,061 people live in Eastside Costa Mesa, where the median age is 40 and the average individual income is $82,687. Data provided by the U.S. Census Bureau.
Total Population
Median Age
Population Density Population Density This is the number of people per square mile in a neighborhood.
Average individual Income
There's plenty to do around Eastside Costa Mesa, including shopping, dining, nightlife, parks, and more. Data provided by Walk Score and Yelp.
Explore popular things to do in the area, including Mesa Yoga & Alternative Therapy, Holy Spirit Gym, and SIGNATURE BY MADELINE TANNING SALON.
| Name | Category | Distance | Reviews |
Ratings by
Yelp
|
|---|---|---|---|---|
| Active | 0.84 miles | 0 reviews | 0/5 stars | |
| Active | 0.87 miles | 2 reviews | 2/5 stars | |
| Beauty | 0.51 miles | 0 reviews | 0/5 stars | |
| Beauty | 0.64 miles | 1 review | 5/5 stars | |
| Beauty | 0.64 miles | 1 review | 1/5 stars | |
| Beauty | 0.73 miles | 1 review | 5/5 stars | |
| Beauty | 0.86 miles | 0 reviews | 0/5 stars | |
|
|
||||
|
|
||||
|
|
||||
|
|
||||
|
|
||||
|
|
Eastside Costa Mesa has 9,955 households, with an average household size of 2. Data provided by the U.S. Census Bureau. Here’s what the people living in Eastside Costa Mesa do for work — and how long it takes them to get there. Data provided by the U.S. Census Bureau. 24,061 people call Eastside Costa Mesa home. The population density is 9,959 and the largest age group is Data provided by the U.S. Census Bureau.
Total Population
Population Density Population Density This is the number of people per square mile in a neighborhood.
Median Age
Men vs Women
Population by Age Group
0-9 Years
10-17 Years
18-24 Years
25-64 Years
65-74 Years
75+ Years
Education Level
Total Households
Average Household Size
Average individual Income
Households with Children
With Children:
Without Children:
Marital Status
Blue vs White Collar Workers
Blue Collar:
White Collar: